
Overview
Power to Decide asked Interactive Knowledge to design and produce an expanded section on their website that explains tele-health options for access to birth control, and shows how access has changed since the Pandemic of 2020. A powerful database backend powers the interactive experience, and an easy spreadsheet upload keeps the data current by administrators.
About this project
The pandemic has altered the landscape for delivering many health services but it doesn’t mean that important services aren’t available. One major change in the delivery of health services is the expansion of tele-health as an accepted approach by both providers and patients. Power to Decide asked us to design and produce an expanded section on their website that explains tele-health options for access to birth control for Medicaid patients compared to women with private insurance.
The project goals
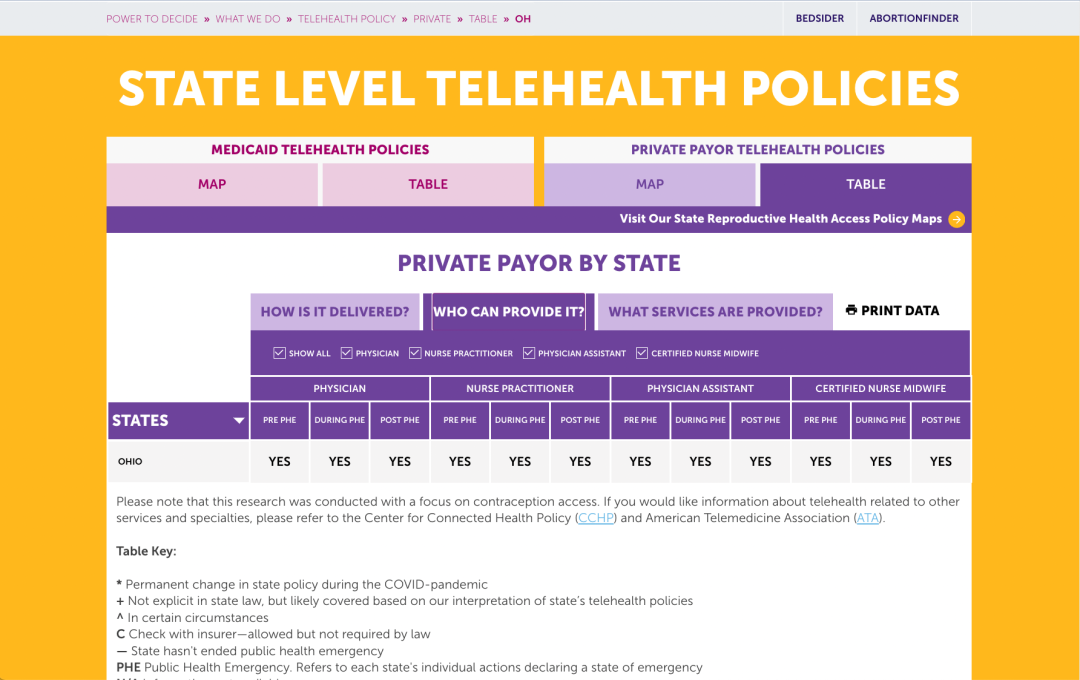
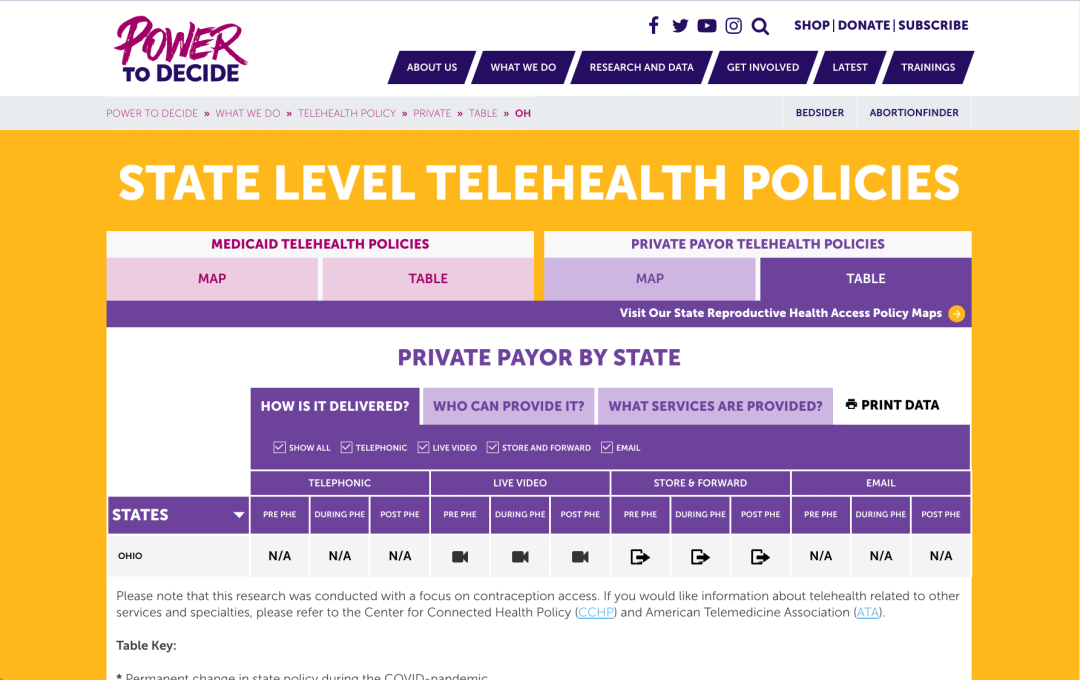
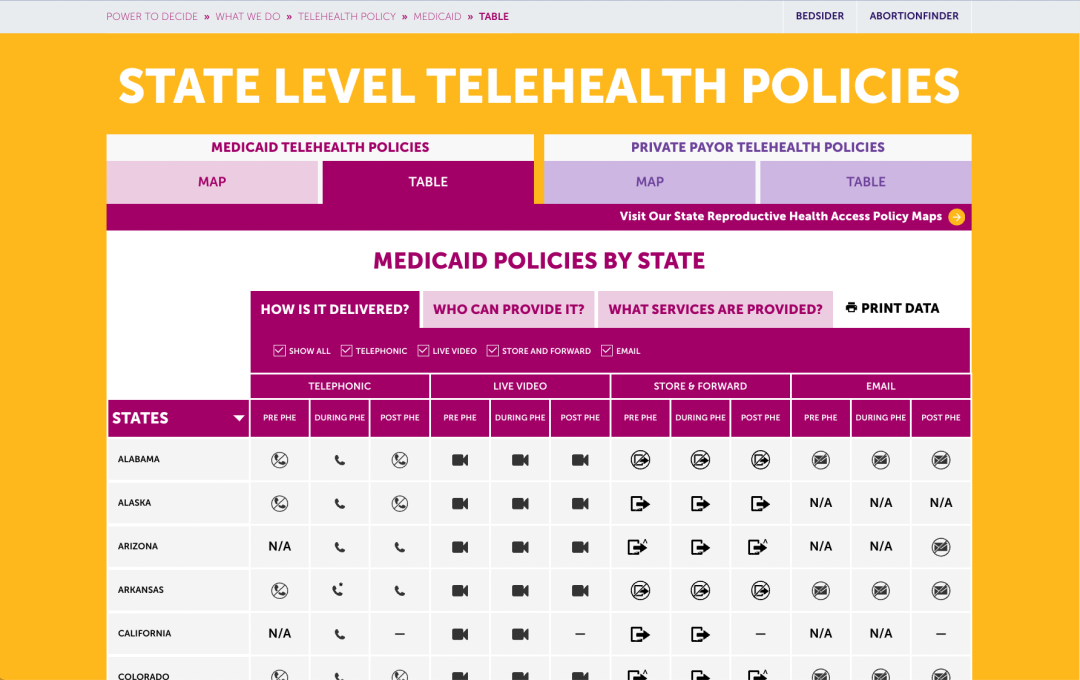
The goal of the project was to highlight differences between services offered to Medicaid patients compared to women with private insurance. A tabbed approach between maps allows users to quickly compare important at-a-glance information for how contraceptive services are delivered, which health professionals can provide it, and what services are available. Because of the changes made to accommodate the pandemic, a comparison between Pre-COVID and During COVID services is included.
The IK approach
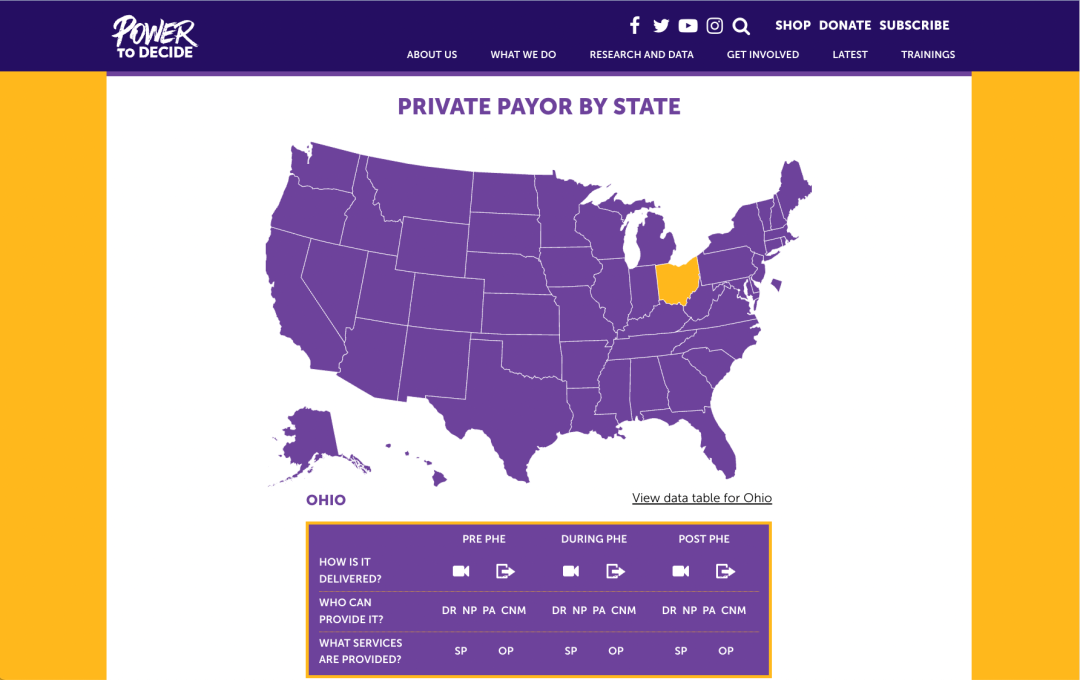
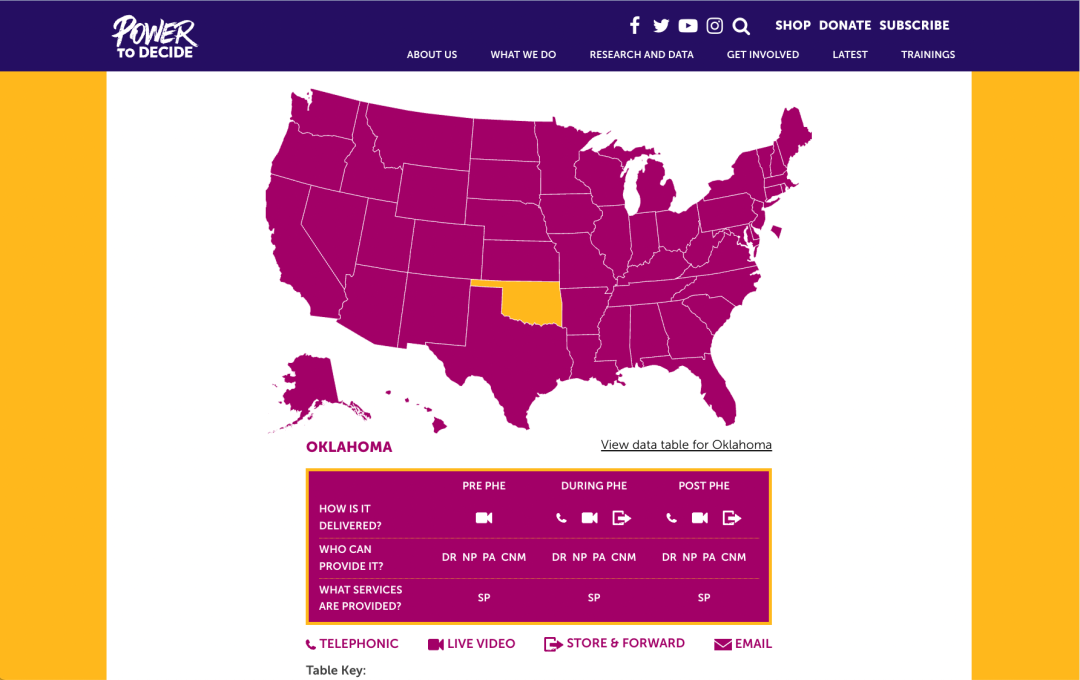
We were challenged with the task of presenting a vast amount of detailed data to users in an easy to consume format. We decided to break up the data by state, as we did for the STATE REPRODUCTIVE HEALTH ACCESS POLICIES, a previous project with Power to Decide. The online content can be filtered by state and is available to view by map or through a more detailed table. Users can quickly hover over states to get an overview of the state policy, and then dive quickly into more details through table views. Tabs further help organize the data, and a drop down filter will allow users to add other states for comparison. Color coding the sections helps to visually separate the services, and adding a Print Data function lets users print a simplified black and white version of the table data.
This online experience has become a powerful tool for contraceptive care advocates. Power to Decide staff were already using a .csv file to keep their data updated. By developing an easy updating process by using their existing spreadsheet, staff can easily keep the site current themselves, without having to return to us.
The Results
The STATE LEVEL TELE-HEALTH POLICIES Maps have been in invaluable tool for policy makers, advocacy groups, researchers and media.